
CAREER
Home > Career
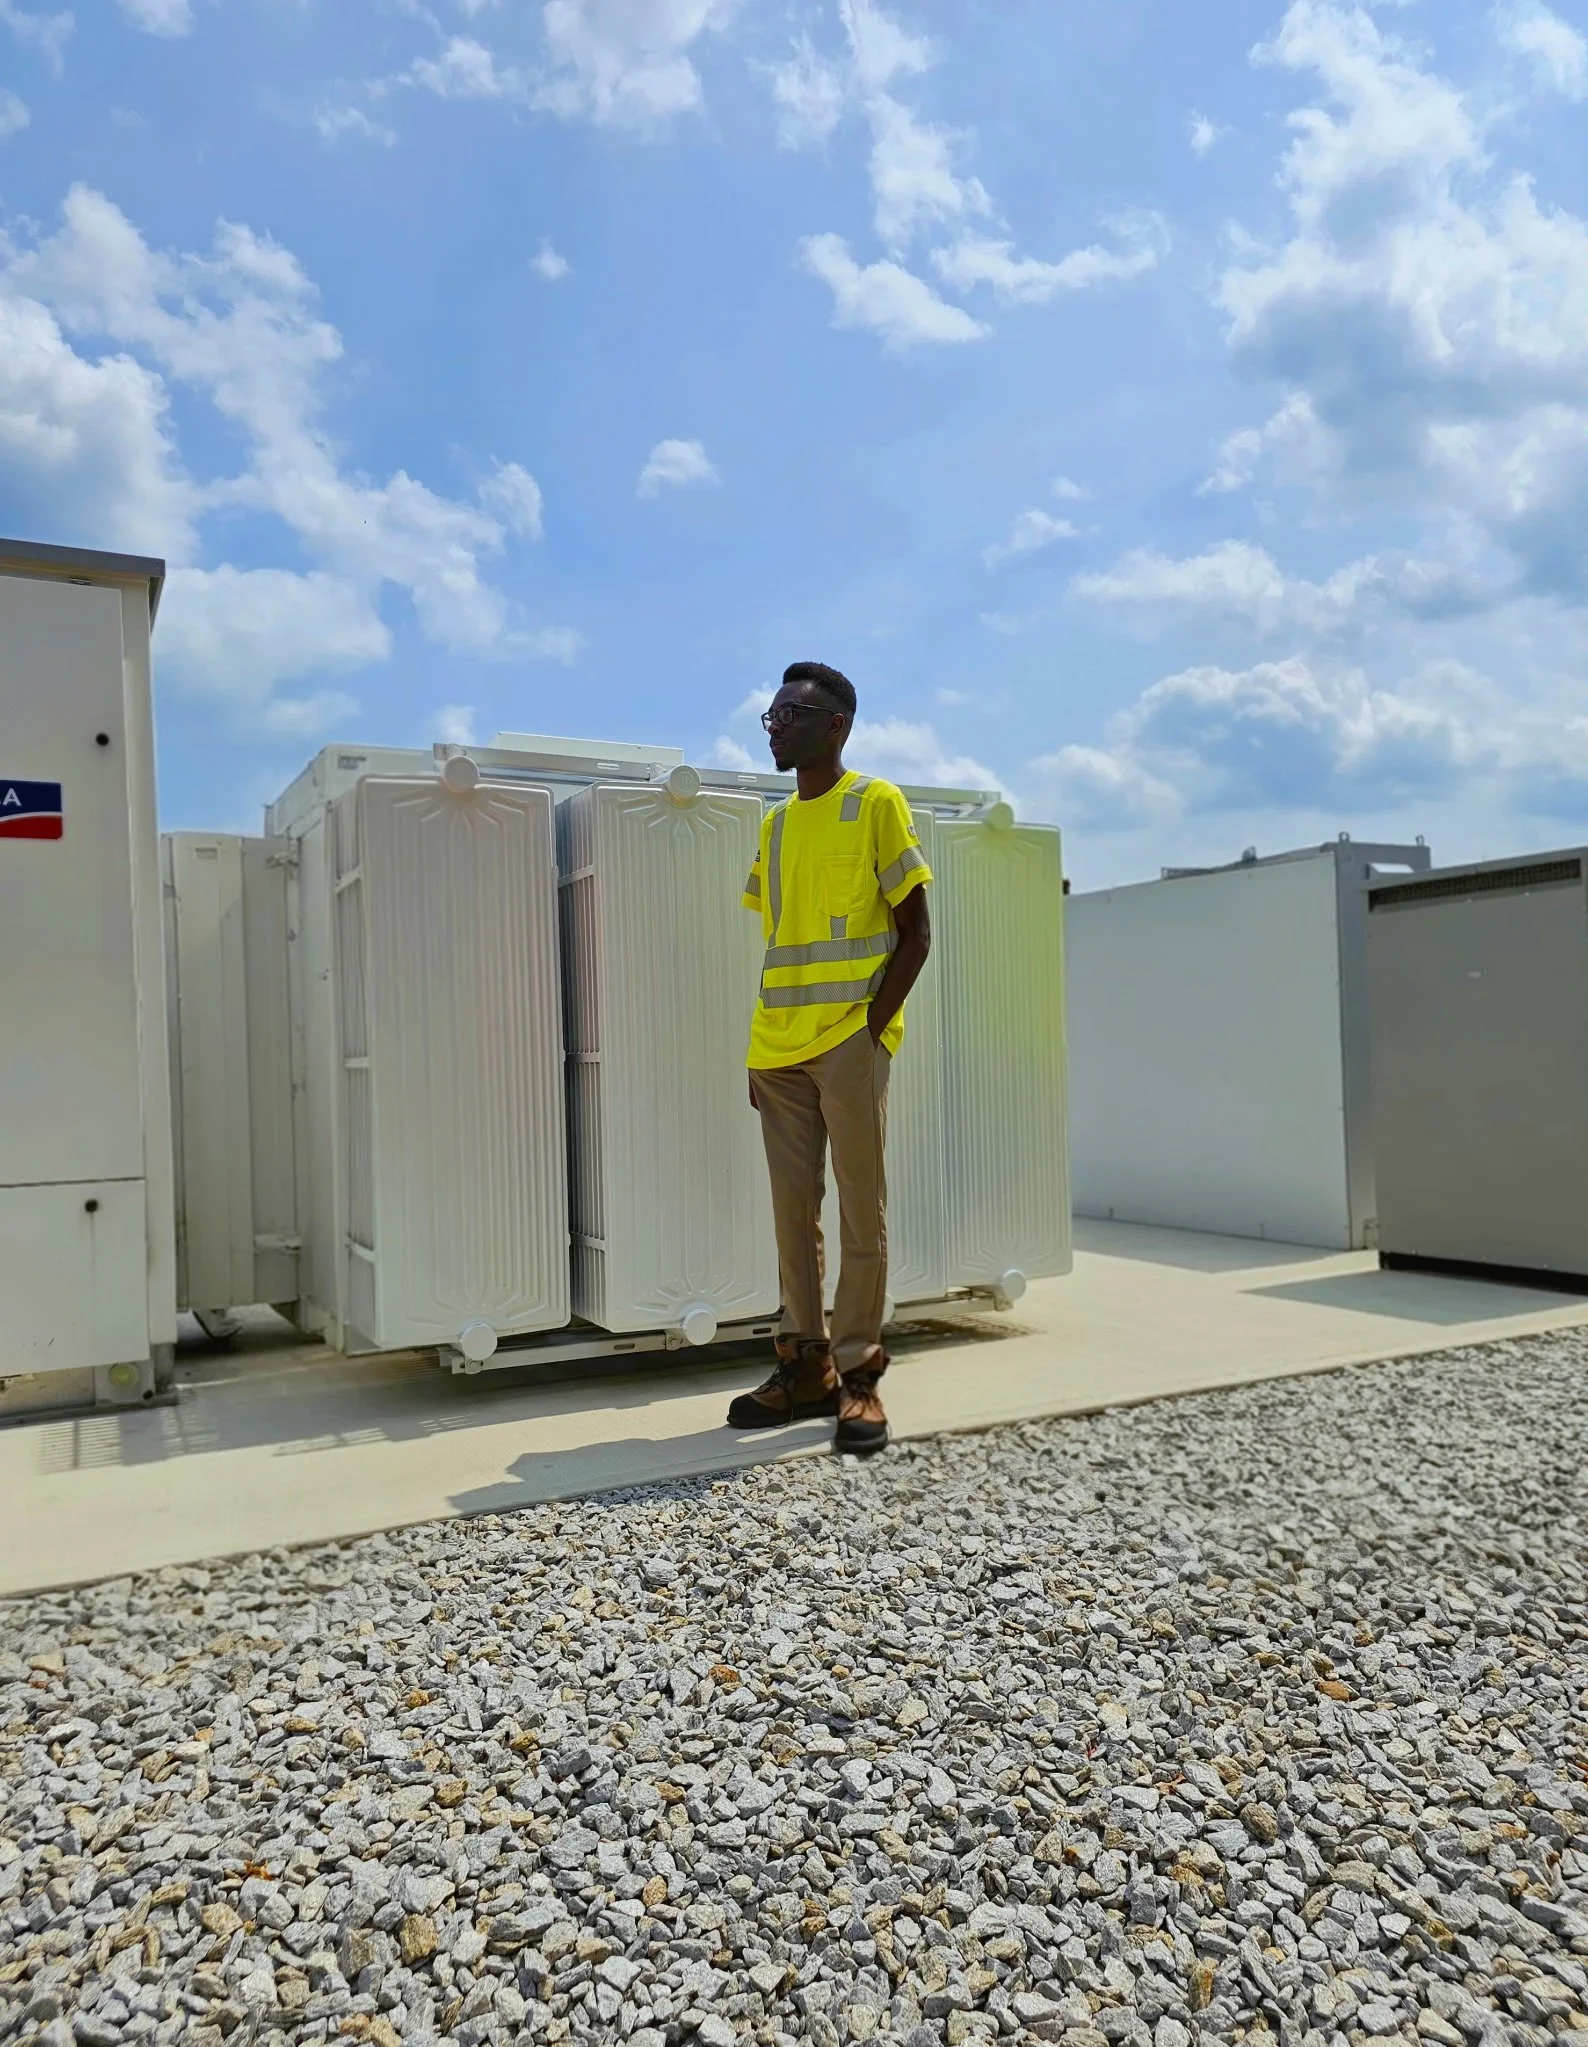
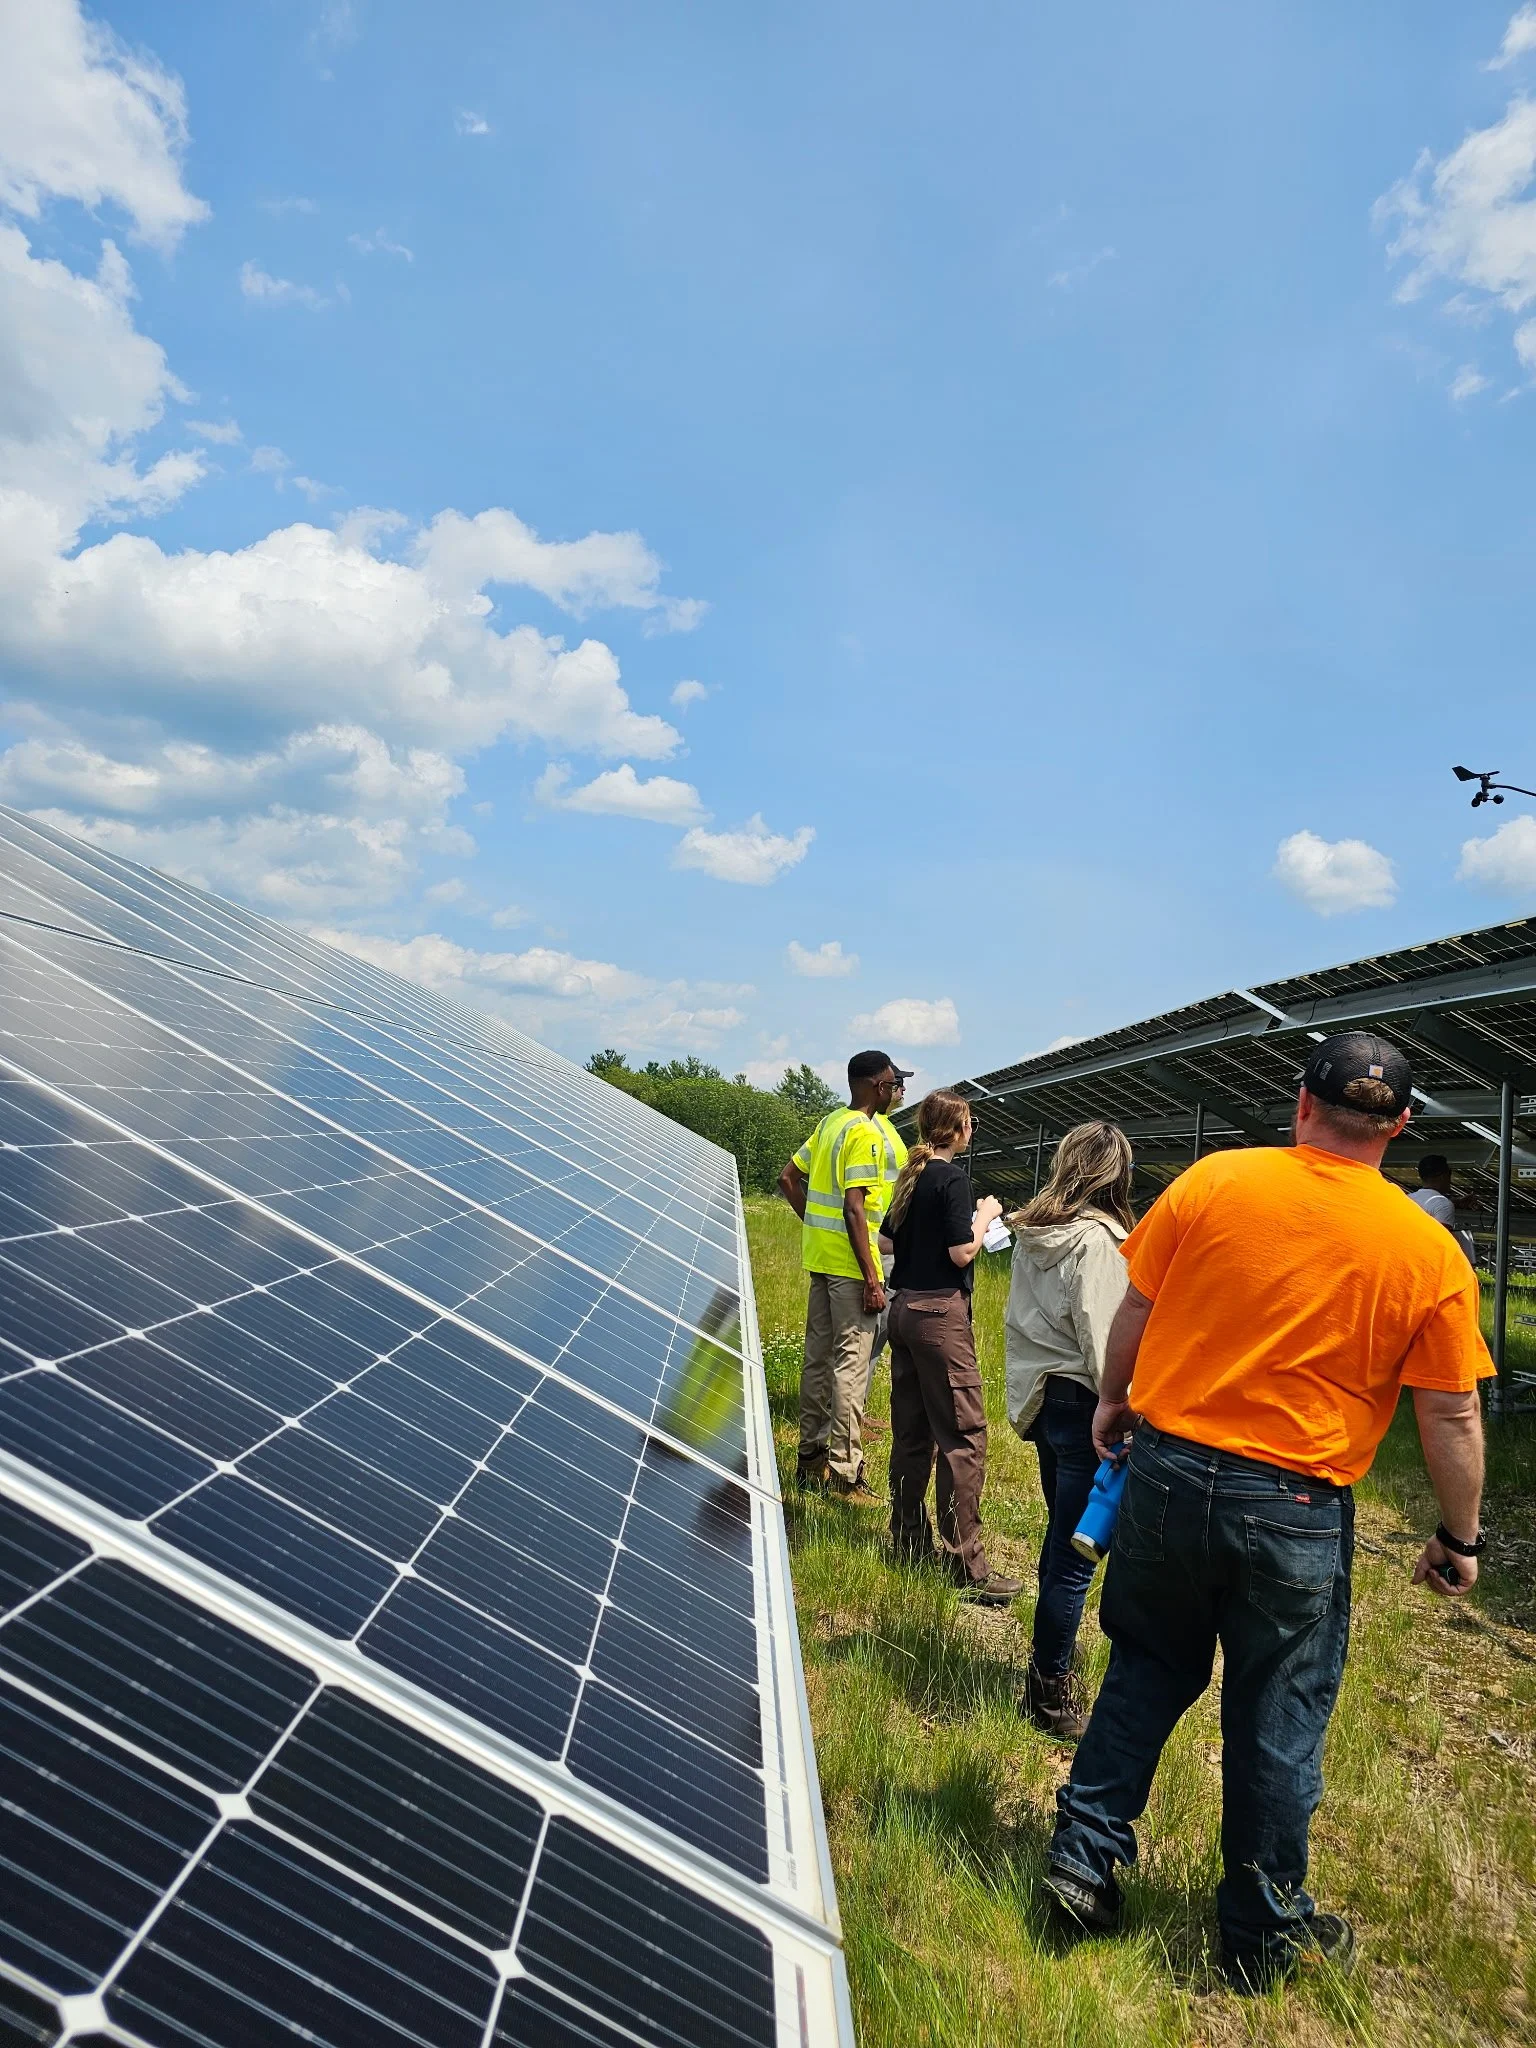
Photos at Nexamp


PROJECT PLANNING AND SCHEDULING
Primavera P6
I built and maintained detailed construction schedules using Primavera P6 for solar and energy storage projects. My work involved collaborating with project managers in weekly meetings to review activity progress, monitor float and deadlines, and ensure logic-driven sequencing across engineering, procurement, and construction phases. These multi-phase schedules tracked key milestones—from early permitting and subcontractor engagement to equipment delivery, site mobilization, and final commissioning—while highlighting project risks, delays, and critical path exposure.

A sample project in Primavera P6 using fictional data.
AUTOMATION & DATA VISIBILITY
Microsoft Excel
In addition to scheduling, I have also developed and maintained Excel spreadsheets for different teams to use. Recognizing that Primavera P6 was often a bottleneck of information for many people given limited access to the software for others, I routinely extracted tables with various sets of information from the software to link to different Excel spreadsheets. I expanded on this by creating simple Excel Queries to grab information from Salesforce as well to make it easy to create sheets by auto-populating columns such as Project Name and the size of projects, among others.
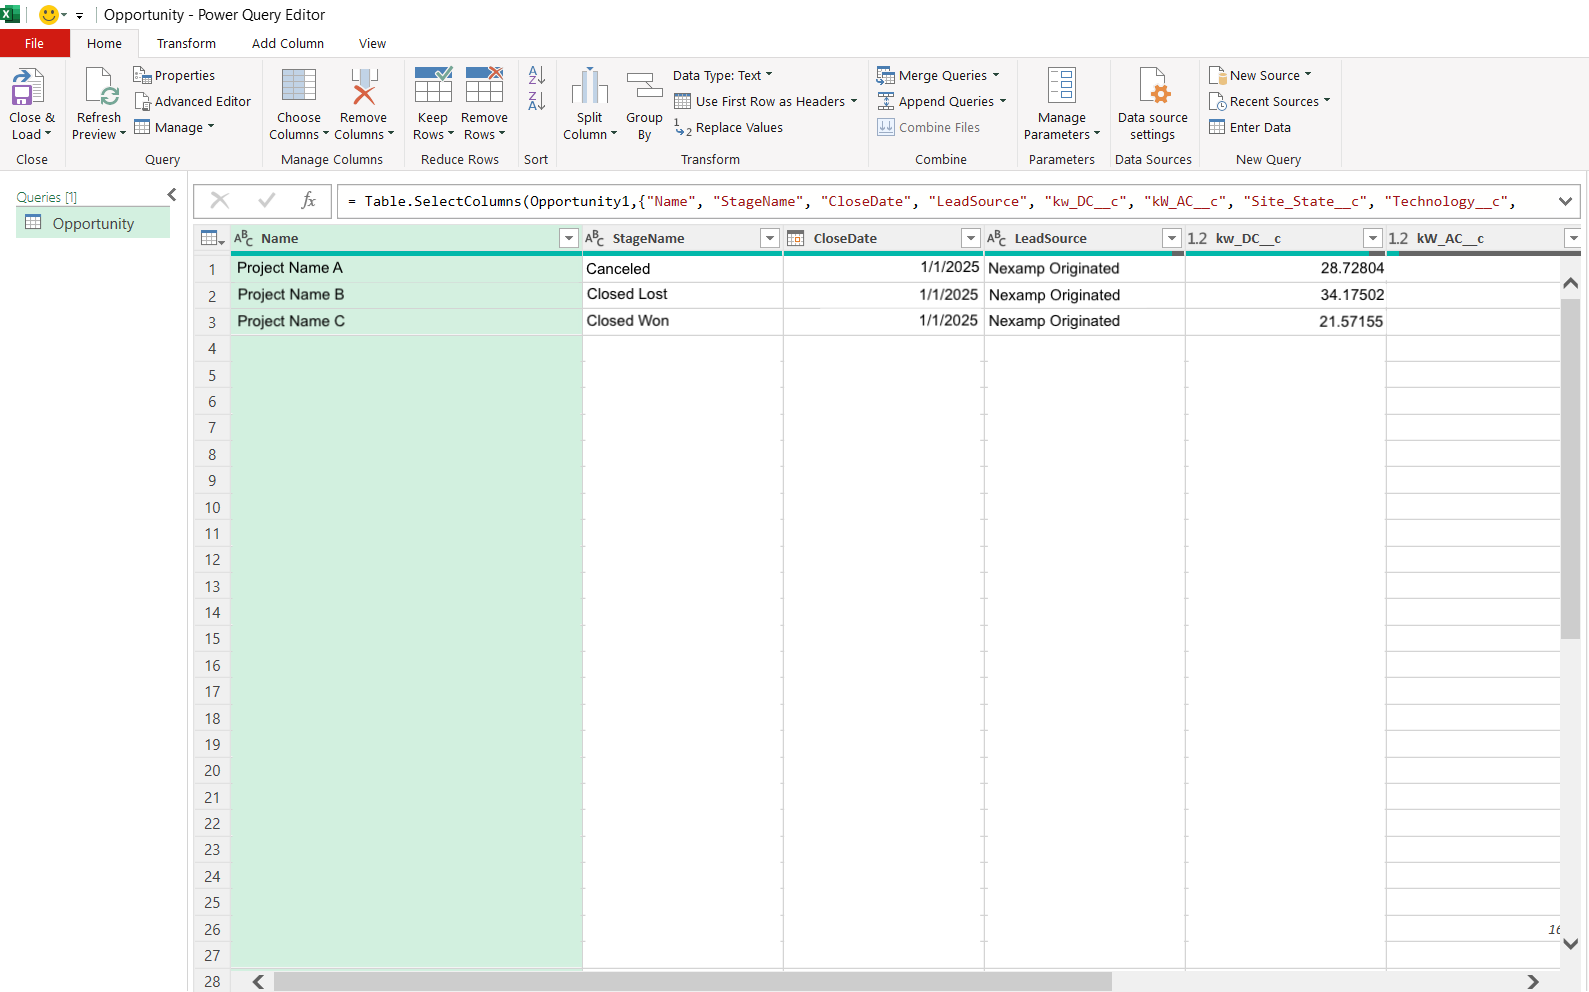
A view of the Power Query Editor in Excel retrieving information from Salesforce. The data in the screenshot is fictional.
DATA REPORTING & DASHBOARD DESIGN
Business Intelligence Dashboards
I designed interactive dashboards to visualize project milestone trends using data sourced from Primavera P6 and other data platforms. These dashboards enabled users to filter by project, phase, or milestone, and highlighted schedule variance using color-coded indicators. Emphasis was placed on usability—incorporating features like slicers, tables, and charts—so stakeholders could quickly assess progress toward different milestone targets.
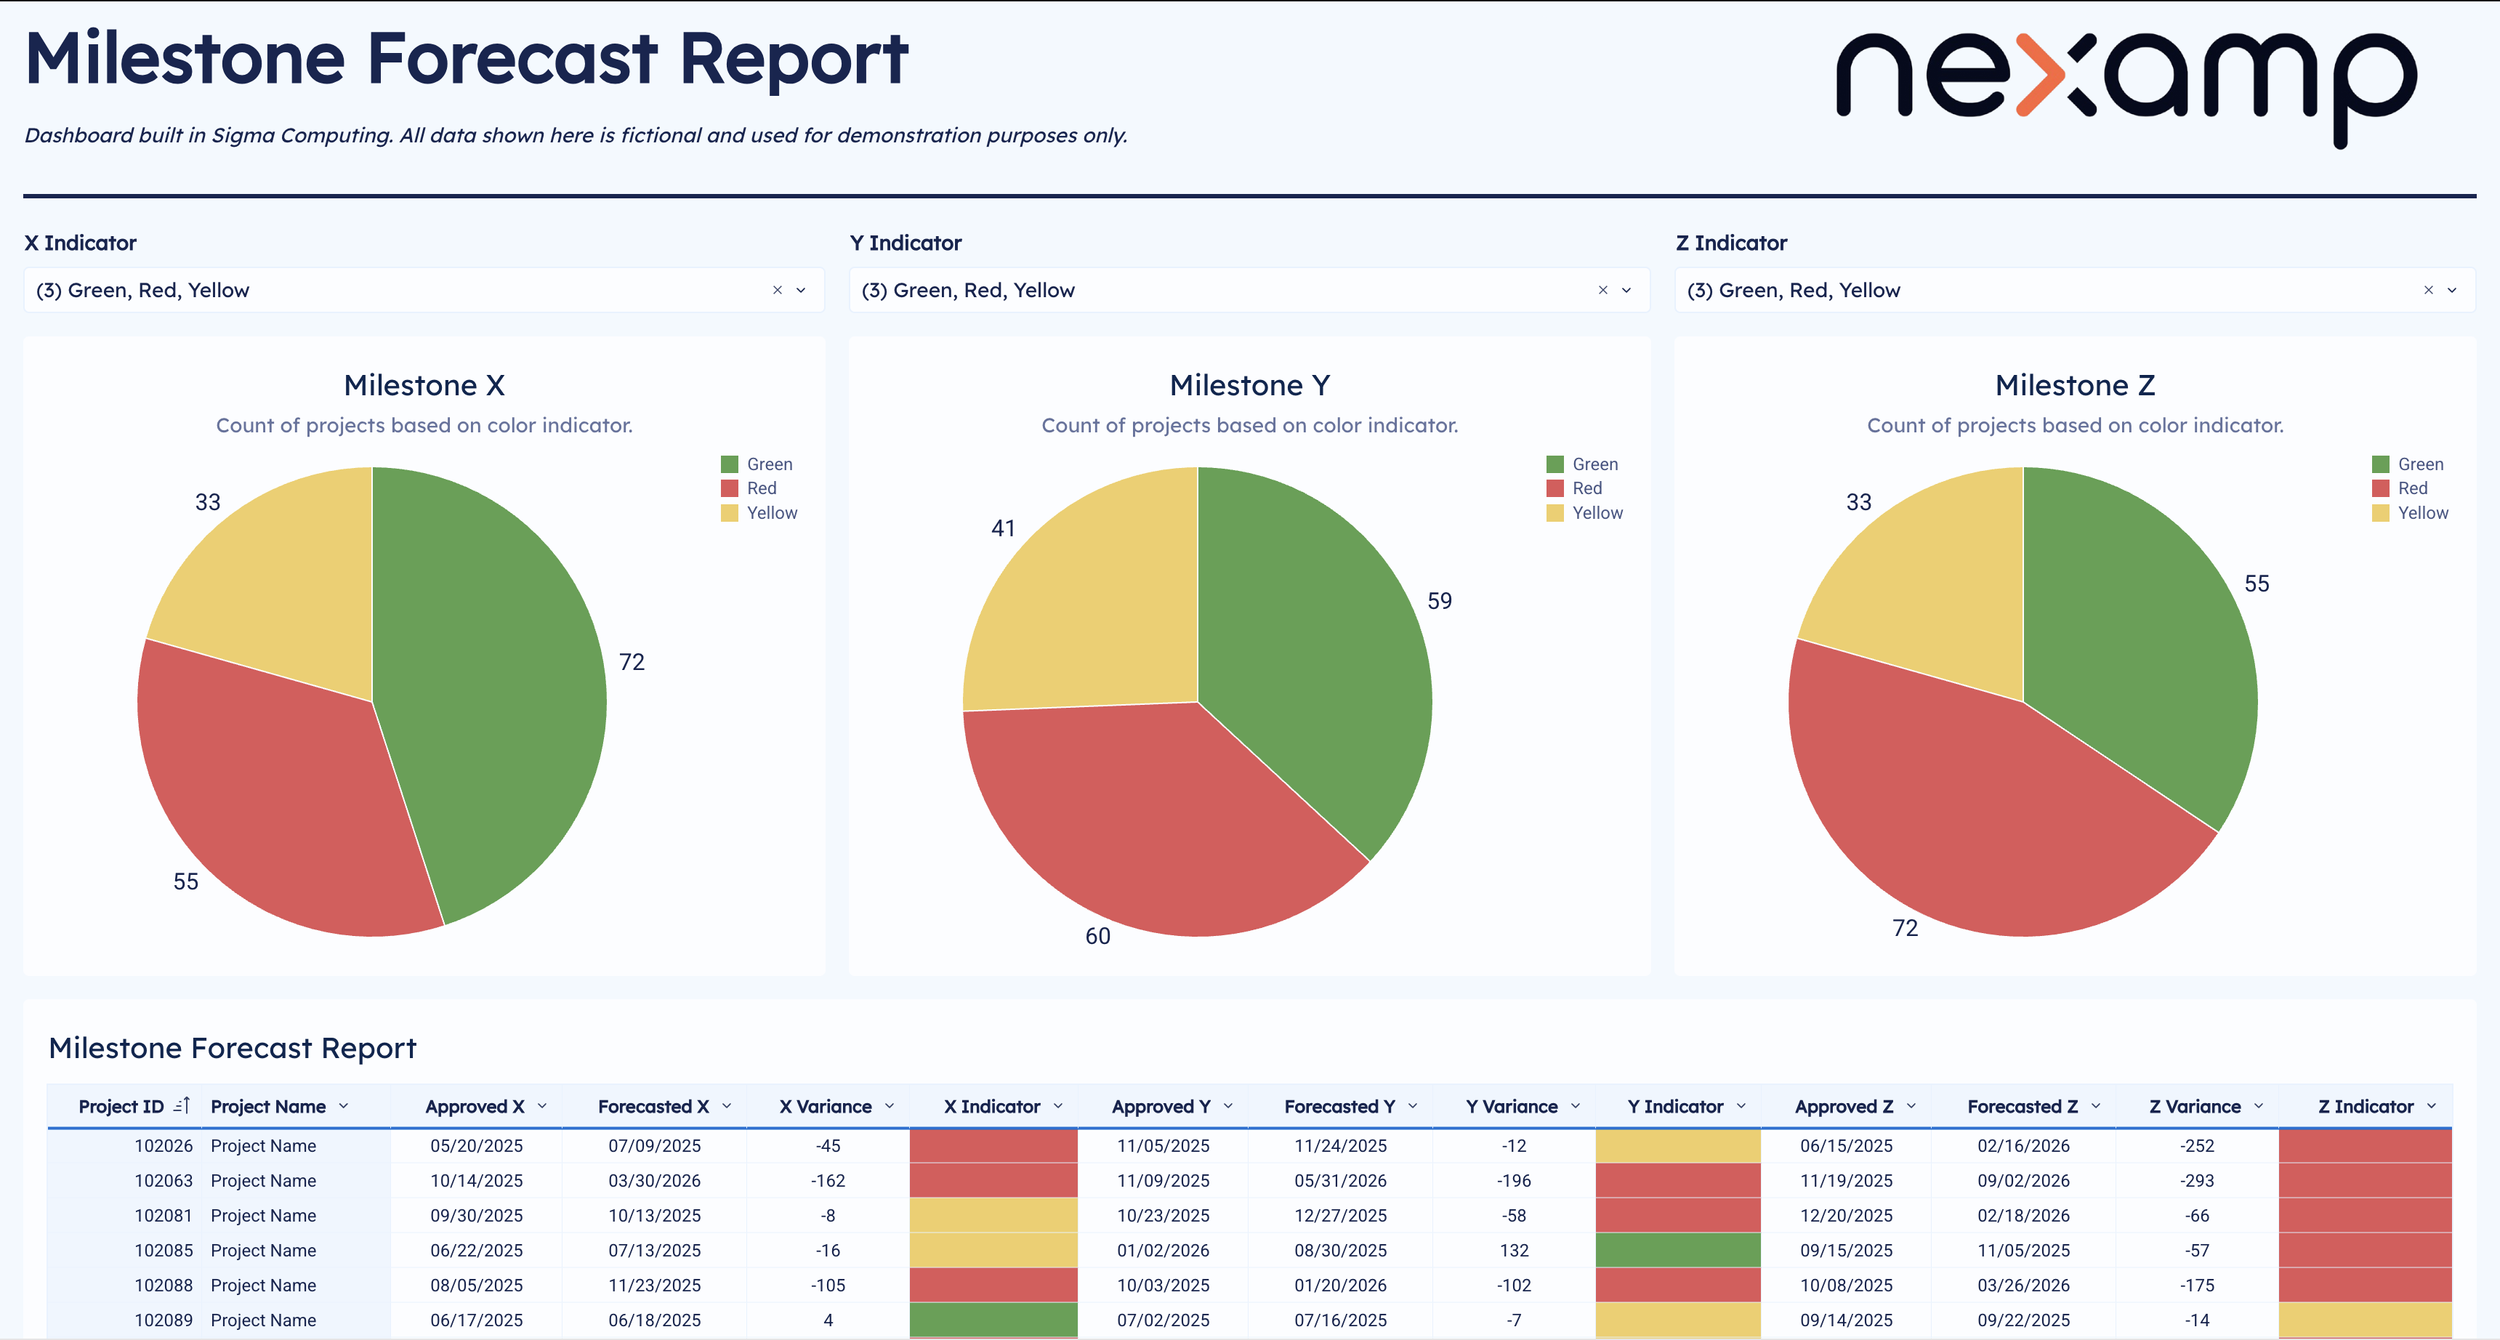
A Sigma Computing dashboard. The data in this screenshot either uses fictional data and/or hides sensitive information.
DURATION REPORTING
Business Intelligence Dashboards
This dashboard reports on task durations in Primavera P6 project schedules, aiding key stakeholders in assessing performance between initial and current plans, forecasting future completion times for ongoing work, and better establish initial planned durations for future projects.
The user selects two tasks to compare, alongside indicating whether it is the start or finish date of each task they are comparing. This could be used to compare the start and finish dates of the same tasks, or compare durations between different tasks.
When tasks are selected, four fields are shown…
the duration between the two tasks in the project template—the generic project file duplicated in Primavera P6 to create new projects,
a box plot of the duration in all baselines—representing the initial planned duration of each project right before work commenced,
a box plot of the duration for projects where both selected tasks have already occured, and
a box plot of the duration for projects where either task is incomplete.
Filters are also provided to give greater insight into the data. For example, users can select projects of a certain size or belonging to a certain region or utility to compare how durations vary between those categories.

A Sigma Computing dashboard. The data in this screenshot either uses fictional data and/or hides sensitive information.
